Problem-Solving and Data Analysis: SAT Ratios and Data
Problem-Solving and Data Analysis is the SAT Math domain that evaluates your quantitative reasoning with ratios, rates, proportional relationships, percentages, unit conversions, and statistical data. Practicing careful unit tracking and table reading helps you translate multi-step real-world scenarios into clean calculations and interpret scatterplots, probability tables, and survey summaries accurately on test day.

Last updated:
Problem-Solving and Data Analysis is the SAT Math section domain that measures your ability to apply ratios, rates, proportional reasoning, percentages, and statistical interpretation to real-world data. Questions often present information through two-way tables, scatterplots, or word problems involving unit conversions and sample surveys.
When solving a multi-step rate or percentage problem, write the units beside each quantity so every conversion factor cancels cleanly on paper. For data display items, check the column totals or scatterplot labels first to confirm which subgroup the question asks about. This same habit of verifying labels and claims also strengthens your accuracy on quantitative graphics in Information and Ideas.
During your practice-test review, check whether any missed items in this domain came from misreading a percentage base—such as mixing up percent of a total with percent change—or selecting the wrong row in a frequency table. Drilling a short set of targeted ratio and table problems each week keeps your quantitative reasoning sharp.
How ExamLuma helps
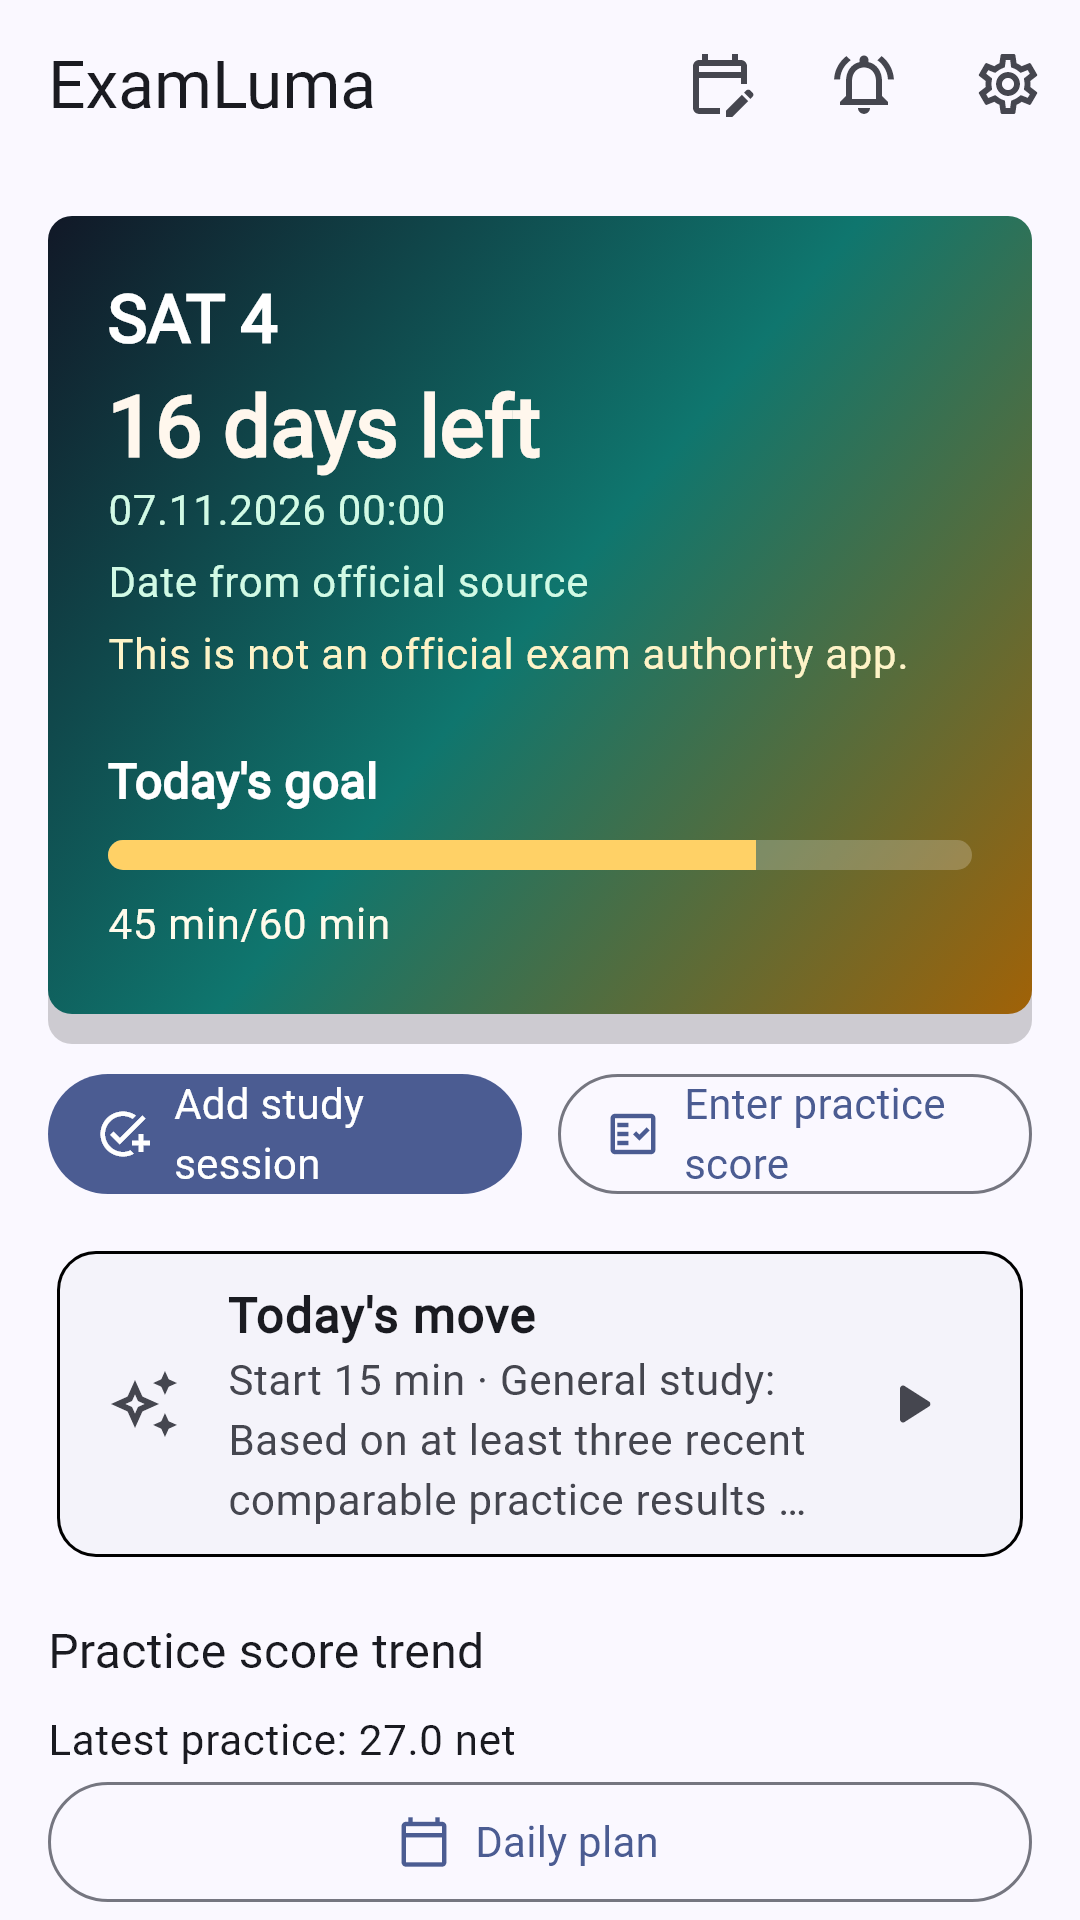
Keep track of your study plan in ExamLuma. ↗
Set a daily study goal and follow your progress. ↗
Record completed study sessions. ↗
Frequently asked questions
What skills are tested in Problem-Solving and Data Analysis?
The domain tests ratios, rates, proportions, percentages, unit conversions, two-way frequency tables, scatterplots, and basic statistical inference.
How can you avoid common traps on unit and percentage questions?
Write the units next to every number in your setup and verify which base value a percentage increase or decrease applies to.
How does data analysis in Math connect to the rest of the SAT?
Careful reading of axis labels, sample sizes, and table categories supports both math data problems and quantitative supporting details items in reading.
Sources
- The Math Section · College Board
- Problem-Solving and Data Analysis — SAT Math · College Board