GMAT Data Insights questions
GMAT Data Insights is the section that tests how you interpret information from tables, charts, numbers and text. Some questions ask which statements make a problem solvable. Others ask you to reconcile information from different sources or draw a conclusion from a graph. An on-screen calculator is available.

Last updated:
GMAT Data Insights tests how you use information in different formats to answer a question. A table might show a retailer’s monthly revenue, while a graph might show customer visits. Before dividing one figure by another, check whether both cover the same stores and period. That check can change the conclusion even when the arithmetic is right.
In a practice question for the GMAT, suppose you need average spending per visit. Revenue alone leaves the answer open. Adding the matching visit count makes the calculation possible. Recognizing when the information is sufficient is one skill covered in the official section description.
How ExamLuma helps
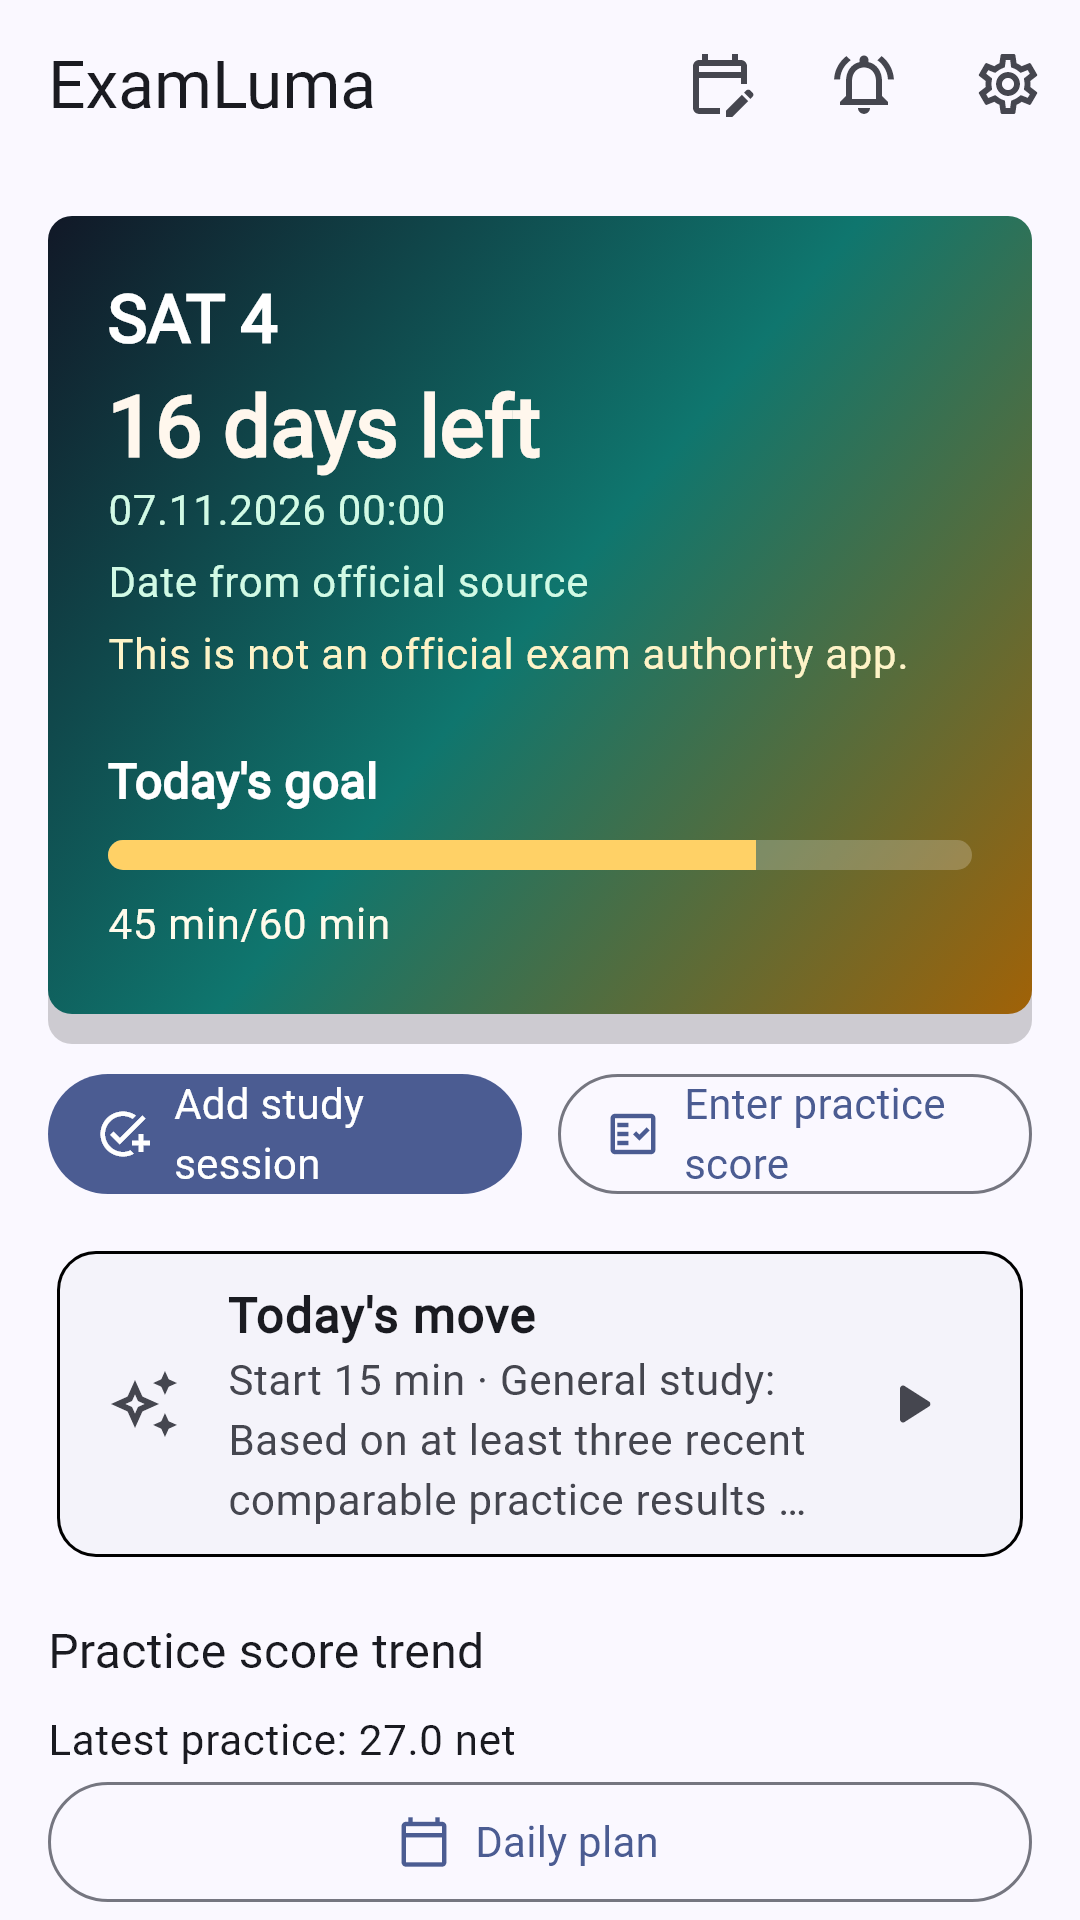
Keep track of your study plan in ExamLuma. ↗
Set a daily study goal and follow your progress. ↗
Record completed study sessions. ↗
Frequently asked questions
What does Data Sufficiency ask?
Decide whether the stated information allows you to answer the question.
Can I use a calculator?
The section includes an on-screen calculator.
What is Multi-Source Reasoning?
It asks you to examine related materials and judge what follows from them.
Sources
- Exam Content · Graduate Management Admission Council